
Excellent Practices
Dashboards for Quality Improvement and Shared Decision Making
Practice Category: Organisation and Quality Systems
Centre: Rijnstate Cancer Centre
Marjet Docter
Policy and Quality, Programme Cancer Care
mdocter@rijnstate.nl
Challenge addressed by the practice
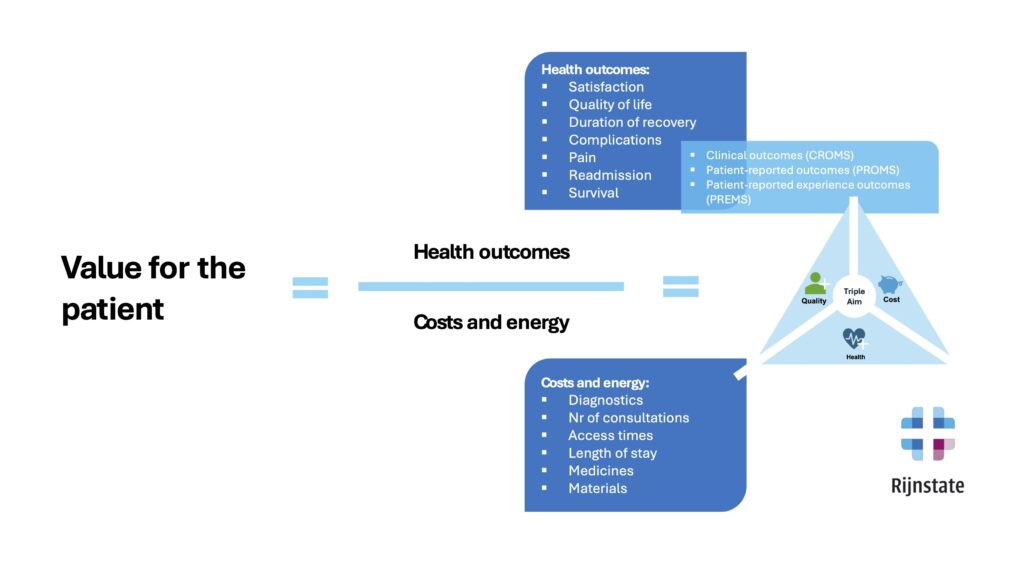
Rijnstate Cancer Centre operates according to the principles of Value-Based Health Care to effectively monitor the relationship between quality, clinical outcomes, and financial performance. The aim is to make information available in a timely, reliable, and directly applicable way for both strategic and clinical decision-making.
High-quality and complete data on clinical outcomes, patient-reported outcomes, and finances are essential to further improve care results at both individual and group level. The ambition is to use care outcomes transparently for shared decision-making in the consultation room. For this reason, the Rijnstate Cancer Centre invests in a robust and future-proof data infrastructure that provides a solid foundation for the further development of personalised care. The main challenge is to clearly define the required management information and to effectively integrate these data sources into a single, coherent structure.
Solution
This has been achieved through close collaboration between the Tumour Working Groups, the Business Intelligence & Data Analytics team, and the Quality team. In recent years, comprehensive dashboards have been developed that provide real-time insight into key outcomes. Based on a dataset grounded in the principles of Value-Based Health Care, these dashboards have been flexibly adapted to the needs of the tumour teams.
The main indicators may differ per tumour working group. As a result, one team may focus on shared decision-making based on patient-reported outcome measures (PROMs) for prostate cancer treatment, while another focuses on throughput times along the patient journey for breast cancer patients. In breast cancer, one key focus area is diagnostics. Radiologists and pathologists work with fully structured reporting, allowing imaging and pathology data to be directly linked. This enables a real-time overview of all biopsies performed, including the corresponding BI-RADS classification and histopathological outcomes.
Impact
Within the Rijnstate Cancer Centre, there are strong cross-links between different tumour working groups. By working with dashboards, teams have learned from and inspired each other.
By recognising that quality improvement starts with conversations about needs and preferences, concrete opportunities for improvement emerge. In the Netherlands, a broad set of national dashboards for quality registries is available, including DICA and the Netherlands Cancer Registry. The cancer care dashboards at Rijnstate provide a valuable addition by offering insight into local data at both team and patient level.
These dashboards enable more in-depth analyses of trends and underlying causes of variation. They combine information on clinical outcomes, patient-reported outcomes and experiences (PROMs and PREMs), process indicators (such as throughput and access times), and costs and benefits.
Critical success factors
- Insights from dashboards are used in the consultation room to support personalised treatment choices. Close collaboration with a patient council or patient organisation is essential for this.
- Strong and accessible collaboration between tumour working groups, the Business Intelligence & Data Analytics team, and the Quality team.
- Monthly tumour working group meetings with dedicated time to review results, perform analyses and identify concrete improvement actions.
- A focus on improvement priorities rather than developing large, complex dashboards.
- Positive experiences and good examples from healthcare professionals help build enthusiasm among other teams.
- As the available time of all stakeholders is limited, this requires clear choices and sharp prioritisation of improvement initiatives. This ensures efforts remain feasible and focused on what truly makes a difference. Discussions and analyses also require time investment from multiple disciplines.
This video (in Dutch) explains how value-driven working with data is implemented at Rijnstate:
Next steps
Continuous improvement process
- Insights from data can help make better-informed decisions. It is essential to have a clear objective in advance: which question do we want to answer, and with which data?
- Objectives and processes may change over time, and the data requirements change accordingly.
- Data products such as dashboards require maintenance to ensure they provide the right information at the right time.
- By also considering which data is not needed, clarity is maintained and it becomes easier to focus on what is important.
- A large number of dashboards can fragment information. A clear key-indicator dashboard provides guidance at management level and helps keep priorities sharp.
- Maintaining focus on value-based healthcare and data-driven analysis within tumour working groups supports continuous quality improvement.
- Exploring benchmarking initiatives.